I haven’t installed an ELK stack since CentOS 7 came out, all of the components which go to make up the stack have been updated quite bit since then so I decided to have a go at installing the stack on a clean CentOS 7 installation.
ELK?
ELK is a term used for a combination of three Open Source products from Elastic ;
- Elasticsearch — Search & Analyze Data in Real Time
- Logstash — Collect, Parse, & Enrich Data
- Kibana — Explore & Visualize Your Data
All three products can be used independently, but when they are used together you find yourself with both a powerful and scaleable central logging service.
There is a good introduction to the stack on YouTube;
Elasticsearch
The only pre-requisite for Elasticsearch is a recent version of Java, the quickest way to install this is directly from Oracle;
 cd /opt
 wget — no-cookies — no-check-certificate — header “Cookie: gpw_e24=http%3A%2F%2Fwww.oracle.com%2F; oraclelicense=accept-securebackup-cookie” “http://download.oracle.com/otn-pub/java/jdk/8u40-b25/jre-8u40-linux-x64.tar.gz"
 tar xvf jre-8*.tar.gz
 chown -R root: jre1.8*
 rm /opt/jre-8*.tar.gz
Now we have a java Runtime installed in /opt/jre1.8* lets use alternatives to set it so the system uses it by default;
alternatives — install /usr/bin/java java /opt/jre1.8*/bin/java 1
java -version
java version “1.8.0_40”
Java(TM) SE Runtime Environment (build 1.8.0_40-b25)
Java HotSpot(TM) 64-Bit Server VM (build 25.40-b25, mixed mode)
So thats Java installed and set as the system default, next up is Elasticsearch itself. There is an official Yum repository so lets use it;
cat >> /etc/yum.repos.d/elasticsearch.repo <> /etc/systemd/system/kibana4.service <> /etc/nginx/conf.d/kibana.conf
and finally start the services;
systemctl start nginx
systemctl enable nginx
Logstash
Like Elasticsearch there is a Yum repository;
cat >> /etc/yum.repos.d/logstash.repo <> /etc/logstash/conf.d/01-lumberjack-input.conf < 5000
 type => “logs”
 ssl_certificate => “/etc/pki/tls/certs/logstash-forwarder.crt”
 ssl_key => “/etc/pki/tls/private/logstash-forwarder.key”
 }
 }
 INPUT
As we will be shipping syslog data to our ELK stack we need to let Logstash how it will look;
 cat >> /etc/logstash/conf.d/10-syslog.conf < { “message” => “%{SYSLOGTIMESTAMP:syslog_timestamp} %{SYSLOGHOST:syslog_hostname} %{DATA:syslog_program}(?:\[%{POSINT:syslog_pid}\])?: %{GREEDYDATA:syslog_message}” }
 add_field => [ “received_at”, “%{@timestamp}” ]
 add_field => [ “received_from”, “%{host}” ]
 }
 syslog_pri { }
 date {
 match => [ “syslog_timestamp”, “MMM d HH:mm:ss”, “MMM dd HH:mm:ss” ]
 }
 }
 }
 SYSLOG
Finally lets send the data to the Elasticsearch installation on localhost;
 cat >> //etc/logstash/conf.d/30-lumberjack-output.conf < localhost }
 stdout { codec => rubydebug }
 }
 OUTPUT
So thats Logstash configured, lets start the service;
 service logstash restart
 chkconfig logstash on
and thats the main stack installed and configured. You should be able to visit the FQDN you specified in the NGINX configuration and see the Kibana dashboard.
Logstash Forwarder
Now we have our main stack installed, let pump some data into it.
This is all run on the server instances you would to report into your newly configured ELK stack.
First of all, lets import the GPG key for the Forwarder repo;
rpm — import http://packages.elasticsearch.org/GPG-KEY-elasticsearch
Now add the repo;
 cat >> /etc/yum.repos.d/logstash-forwarder.repo <> /etc/logstash-forwarder.conf << FORWARD
 {
 The network section covers network configuration :)
 “network”: {
 “servers”: [ “elk.mckendrick.io:5000” ],
 “timeout”: 15,
 “ssl ca”: “/etc/pki/tls/certs/logstash-forwarder.crt”
 },

The list of files configurations
 “files”: [
 {
 “paths”: [
 “/var/log/messages”,
 “/var/log/secure”,
 “/var/log/fail2ban.log”
 ],
 “fields”: { “type”: “syslog” }
 }
 ]
 }
 FORWARD
as you can see I am shipping /var/log/messages, /var/log/secure and /var/log/fail2ban.log over to my ELK stack.
Finally we need to start the service and configure to start on boot;
 service logstash-forwarder restart
 chkconfig logstash-forwarder on
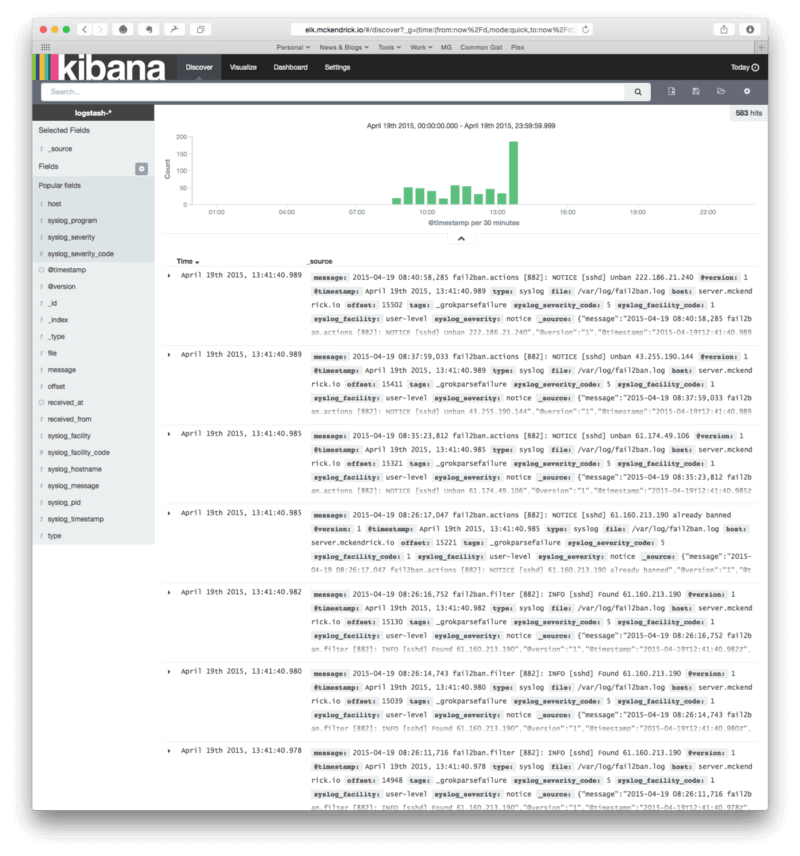
and hey presto, we now have data appearing in Kibana;